What do the public markets tell us about the outlook for the supply chain this year, for investment, strategy, and opportunities?
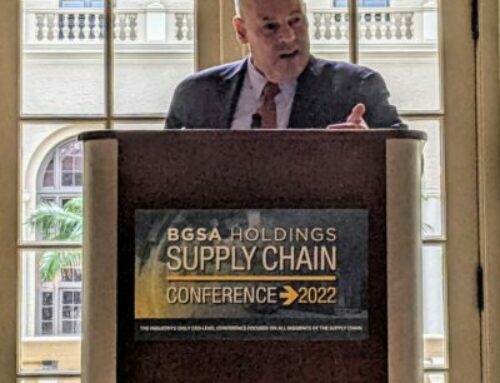
At the BGSA Supply Chain 2024 conference, we sifted through both public company and private market data, looking for patterns, learnings, and strategic implications for CEOs.
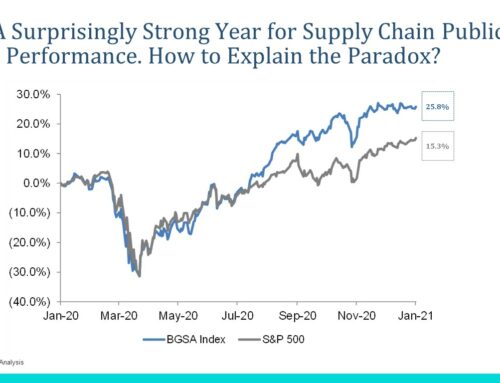
The BGSA Supply Chain Index is a basket of 61 companies across nine segments, including logistics, trucking, rail, supply chain technology, and all other related segments. While the S&P 500 grew 24.7%, the BGSA Supply Chain Index only increased 15.2%.
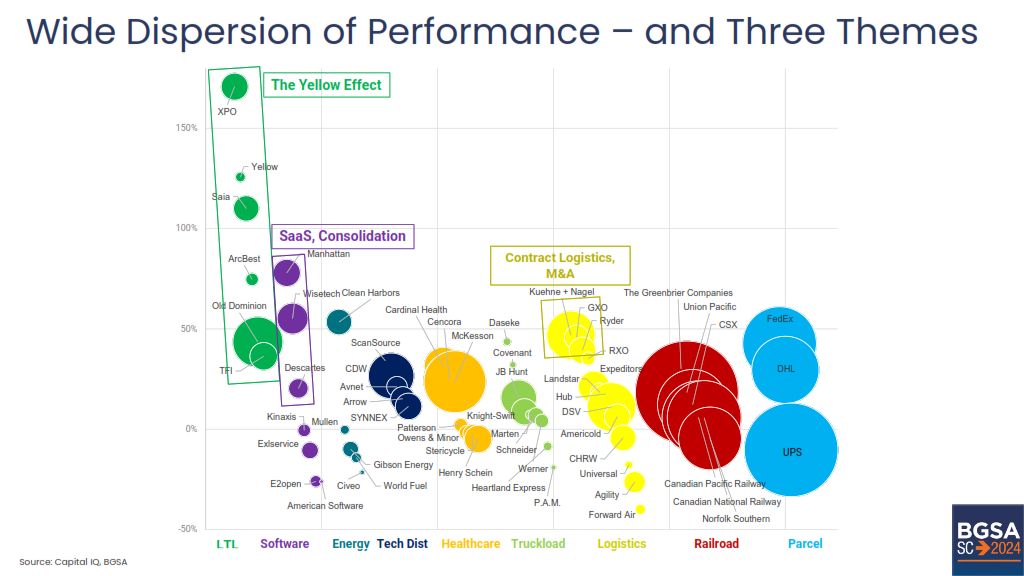
Taking a closer look, we saw a major divergence between overperformers and underperformers. While the category as a whole generated a 15.2% annual return, the LTL sector dominated, with a 60.0% value increase led by XPO (171%). If you had invested in XPO, you would have a terrific year! Supply chain software also generated strong results, with a 33.3% boost spearheaded by Manhattan Associates (78%) and WiseTech Global (55%). And three logistics companies (Kuehne+Nagel, GXO Logistics. and Ryder System) led the way in contract logistics, delivering 39-47% growth.
As we analyze the public company investment data, we can see three themes emerge:
1. LTL: Addition through Subtraction. The Yellow bankruptcy removed capacity from the market, boosted market pricing, and enabled other LTL carriers to gain revenue
2. Software: Clouds Clear. The most successful public supply chain software companies achieved strong growth in Software-as-a-Service (e.g. 96% recurring revenue growth at WiseTech). In addition, they accelerated through acquisitions like WiseTech-Envase and Descartes Systems Group-GroundCloud.
3. Logistics: Greed is Good, but Bland is Better. In a volatile market, the top performers were contract logistics giants like K&N, GXO and Ryder, who delivered steady growth supported by predictable long-term contracts, and boosted by acquisitions like K&N-Farrow, GXO-PFSweb and Ryder-Impact.
The chart below illustrates 2023 stock market performance for each of these companies. The size of the bubble reflects market capitalization. And the y-axis shows 2023 results. The data is illuminating, and provoked a lot of discussion this past week here about investment, strategy, and implications at our CEO conference.
For more on the supply chain outlook, stay tuned for more followups from the BGSA conference!
–Benjamin Gordon, Cambridge Capital
p.s. Please note: this article does not represent not investment advice. I wrote this analysis as a way to understand trends in supply chain and contribute to the dialogue around better assessing our industry. If you have feedback, please feel free to share directly, as I welcome input.